Support for LGBT Rights in the US: PRRI's 2025 50-State Survey
A detailed analysis of public opinion on anti-discrimination protections, same-sex marriage, and transgender rights in the United States.
Contents
The Public Religion Research Institute (PRRI) is an independent American nonprofit research center that studies the intersection of religion, culture, and politics. As part of its 2025 American Values Atlas, the institute surveyed more than 22,000 American adults and produced an analysis of support for LGBT rights across all 50 states. The survey was conducted online from February 28 to December 8, 2025. The margin of error at the national level is ±0.87 percentage points at a 95% confidence level.
The study covers three key areas: anti-discrimination protections, religiously based service refusals, and same-sex marriage. A separate section is devoted to transgender rights.
LGBT Americans: Size, Age, Politics, Religion
One in ten Americans identifies as LGBT – including 4% as bisexual, 3% as gay or lesbian, and 2% who choose “other.” Since 2016, this share has more than doubled – from 4% to 10%.
| Age group | LGBT share |
|---|---|
| 18–29 | 20% |
| 30–49 | 11% |
| 50–64 | 5% |
| 65 and older | 4% |
Overall, differences between men and women are small, but within age groups they are noticeable. Among young Americans aged 18–29, women are nearly twice as likely as men to identify as LGBT: 26% versus 14%. This is partly explained by a higher rate of bisexual identification among young women – 13% compared with 6% among men in the same group. In the 30–49 age group, there are no gender differences. In older age groups, the pattern reverses: among people aged 50–64, men are more likely to identify as LGBT (7% versus 3%), and among those 65 and older – 5% versus 2%.
In terms of political views, LGBT Americans differ markedly from the general population. 40% of LGBT Americans identify as Democrats, compared with 28% among all Americans, while only 11% identify as Republicans, versus 31%. Roughly equal shares call themselves independents: 25% among LGBT Americans and 26% among all Americans. Nearly one in four LGBT Americans (24%) identifies with another party or is undecided, compared with 15% among all Americans. 51% of LGBT Americans consider themselves politically liberal, versus 26% of the general population, while 15% identify as conservative, compared with 36%.
| LGBT | All Americans | |
|---|---|---|
| Democrats | 40% | 28% |
| Independents | 25% | 26% |
| Republicans | 11% | 31% |
| Liberals | 51% | 26% |
| Moderates | 31% | 36% |
| Conservatives | 15% | 36% |
Differences in religious affiliation are also significant. More than half of LGBT Americans (51%) do not identify with any religion (compared with 27% among all Americans). Since 2016, the share of religiously unaffiliated within the LGBT community has grown from 46% to 51%. LGBT Americans are also more likely to identify with non-Christian religions: 12% versus 7%. At the same time, they are half as likely to identify with white Christian groups: 18% versus 40%.
| Religious category | LGBT | All Americans |
|---|---|---|
| Religiously unaffiliated | 51% | 27% |
| Non-Christians | 12% | 7% |
| Christians of color | 19% | 25% |
| White Christians | 18% | 40% |
Among LGBT Americans, 52% are classified as Christian nationalism rejecters – roughly double the share among all Americans (27%). Accordingly, LGBT people are less likely to be skeptics (30% versus 37%), sympathizers (10% versus 21%), or adherents (5% versus 11%) of Christian nationalism.
Where LGBT Americans Live
The highest shares of LGBT residents are found in the District of Columbia and several western states.
| State | LGBT share |
|---|---|
| Nevada | 17% |
| Rhode Island | 16% |
| District of Columbia | 15% |
| Alaska | 15% |
| Wyoming | 14% |
| Virginia | 14% |
| Maine | 14% |
| Nebraska | 14% |
| Oregon | 13% |
| Kentucky | 13% |
| Delaware | 13% |
| … | … |
| Kansas | 6% |
| Hawaii | 5% |
| South Dakota | 5% |
Trends Over a Decade
Over the ten years during which PRRI has been asking the same questions, attitudes toward LGBT rights have shifted unevenly.
| Indicator | 2015 | Peak | 2025 |
|---|---|---|---|
| Anti-discrimination protections | 71% | 80% (2022) | 72% |
| Opposition to service refusals | 59% | 66% (2021) | 59% |
| Same-sex marriage | 53% | 69% (2022) | 65% |
Across all three areas, support rose through the early 2020s and then partially retreated.
Same-Sex Marriage
Support for same-sex marriage in the United States has grown significantly over ten years: from 53% in 2015 to 65% in 2025. In all but two states, a majority of residents support same-sex marriage.
By Party Affiliation (2015–2025 Trends)
| Party | 2015 | 2025 | Change |
|---|---|---|---|
| Democrats | 66% | 83% | +17 pp |
| Independents | 58% | 69% | +11 pp |
| Republicans | 34% | 49% | +15 pp |
Among independents, support peaked in 2022 (73%) before declining slightly. Over the past decade, support among independents has consistently exceeded the national average by about 4 percentage points.
By State
| States with the highest support | States with the lowest support | ||
|---|---|---|---|
| Massachusetts | 85% | Oklahoma | 53% |
| Rhode Island | 85% | Louisiana | 53% |
| Vermont | 81% | West Virginia | 52% |
| Arkansas | 50% | ||
| Mississippi | 47% |
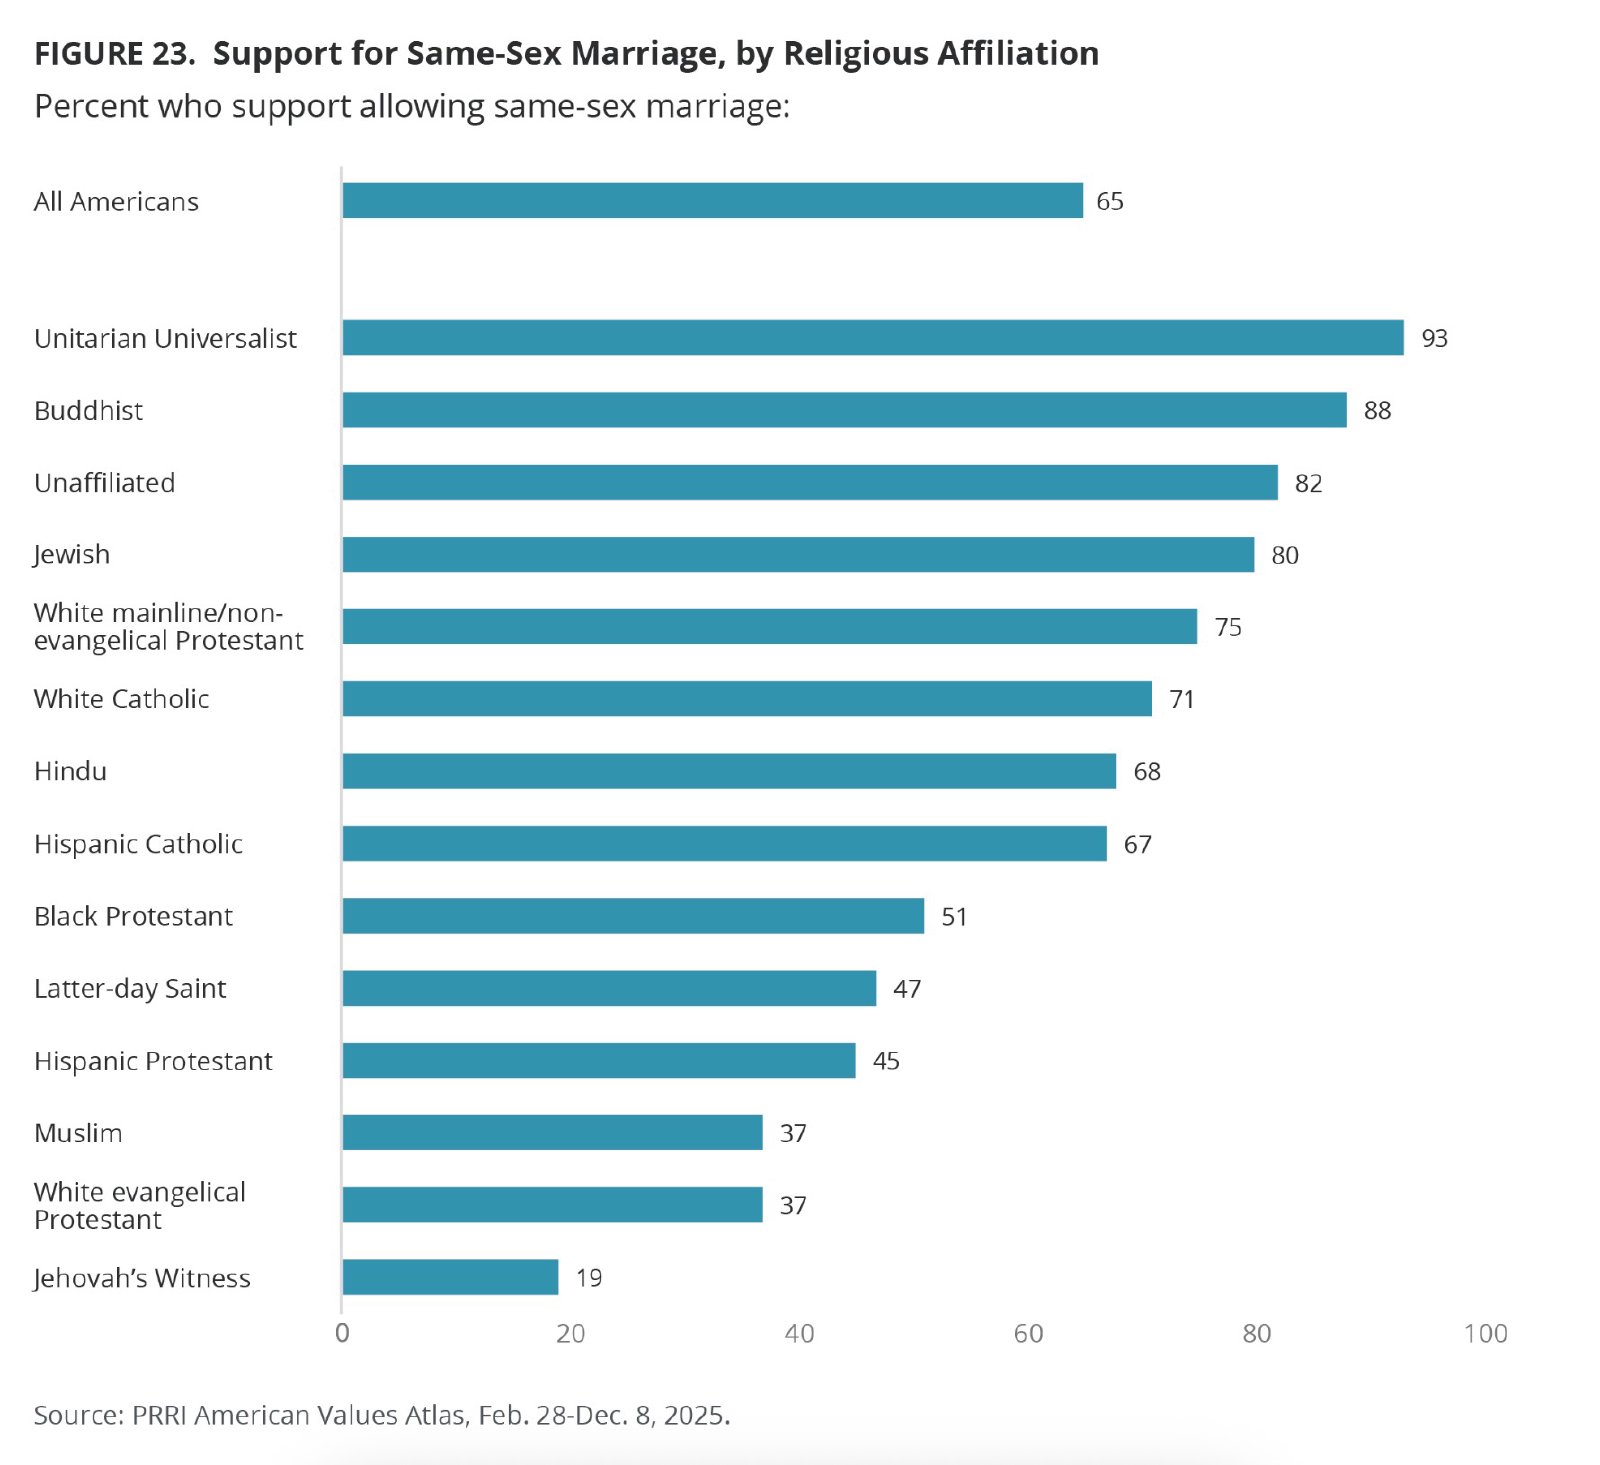
By Religious Group
| Religious group | Support for same-sex marriage |
|---|---|
| Unitarians | 93% |
| Buddhists | 88% |
| Religiously unaffiliated | 82% |
| American Jews | 80% |
| White mainline Protestants | 75% |
| White Catholics | 71% |
| Hindus | 68% |
| Hispanic Catholics | 67% |
| Black Protestants | 51% |
| Latter-day Saints | 47% |
| Hispanic Protestants | 45% |
| White evangelical Protestants | 37% |
| Muslims | 37% |
| Jehovah’s Witnesses | 19% |
Trends by Religious Group (2015–2025)
| Group | 2015 | Peak | 2025 |
|---|---|---|---|
| White Christians | 45% | — | 59% |
| Christians of color | 43% | 61% (2021) | 55% |
| Non-Christians | 70% | 81% (2021) | 76% |
| Religiously unaffiliated | 78% | 87% (2021) | 82% |
Age Trends
Support continues to grow in nearly all age groups. The exception is Americans under 30: among them, support has declined from 71% in 2015 to 67% in 2025. This is primarily driven by young independent voters, among whom support has fallen from 75% to 64%. At the same time, among young Democrats, support has risen from 80% to 87%, while among young Republicans it has remained stable.
| Age group | 2015 | 2025 | Change |
|---|---|---|---|
| 18–29 | 71% | 67% | −4 pp |
| 30–49 | 56% | 68% | +12 pp |
| 50–64 | 48% | 63% | +15 pp |
| 65 and older | 41% | 61% | +20 pp |
By Demographic Group (Gender, Race, Education)
| Group | 2015 | 2025 |
|---|---|---|
| Women | 58% | 66% |
| Men | 50% | 63% |
| Asian Americans | — | 69% |
| Multiracial Americans | — | 68% |
| White Americans | 56% | 68% |
| Hispanic Americans | 53% | 62% |
| African Americans | 43% | 52% |
| College-educated | 64% | 74% |
| Without a college degree | 50% | 60% |
Support for same-sex marriage has grown across all racial and educational groups since 2015.
Anti-Discrimination Protections
Protecting LGBT people from discrimination in employment, public services, and housing enjoys broad support – 72% of Americans.
By Party Affiliation
| Party | 2015 | 2025 |
|---|---|---|
| Democrats | 78% | 90% |
| Independents | 73% | 76% |
| Republicans | 61% | 56% |
Since 2015, support among Democrats has increased by 12 percentage points. Among Republicans, it rose to 66% in 2022 but then fell to 56% – below the 2015 level. Since 2024, independents have become notably more supportive than the general population (76% versus 72%).
By State
| States with the highest support | States with the lowest support | ||
|---|---|---|---|
| Massachusetts | 85% | Mississippi | 60% |
| District of Columbia | 82% | Wyoming | 57% |
| Maryland | 82% | Arkansas | 53% |
| Alaska | 81% |
By Religious Group
Majorities of all religious groups support anti-discrimination measures, though levels vary. The only group without a majority is Jehovah’s Witnesses (48%).
| Religious group | Support |
|---|---|
| Unitarians | 92% |
| American Jews | 82% |
| Buddhists | 82% |
| Religiously unaffiliated | 82% |
| Hispanic Catholics | 77% |
| Hindus | 75% |
| White mainline Protestants | 74% |
| White Catholics | 74% |
| Black Protestants | 73% |
| Latter-day Saints | 67% |
| Hispanic Protestants | 59% |
| Muslims | 57% |
| White evangelical Protestants | 54% |
| Jehovah’s Witnesses | 48% |
The trend among white Christians has been uneven: their support rose from 67% in 2015 to 76% in 2022, then fell back to 66%. Among Christians of color, support peaked at 78% in 2022 before declining to 71%. Among religiously unaffiliated and non-Christians, support also peaked in 2021–2022 (86–87%) before returning to earlier levels.
Age Trends
In 2025, all age groups show roughly the same level of support – around 70%. However, young Americans aged 18–29 have seen a decline over the decade, from 80% to 70%, mainly due to young Republicans: among them, support has dropped from 74% to 50%. Among older Americans (65 and older), by contrast, support has risen from 61% to 74%.
By Demographic Group
| Group | Support |
|---|---|
| Asian Americans | 77% |
| White, multiracial, and Hispanic Americans | 72% |
| African Americans | 68% |
| Women | 74% |
| Men | 69% |
| College-educated | 78% |
| Without a college degree | 67% |
Religiously Based Service Refusals
59% of Americans oppose allowing small businesses to refuse service to LGBT people on religious grounds.
By Party Affiliation
| Party | 2015 | 2025 |
|---|---|---|
| Democrats | 74% | 82% |
| Independents | 59% | 60% |
| Republicans | 40% | 35% |
Opposition to service refusals has increased by 8 percentage points among Democrats. Among Republicans, conversely, it has declined by 5 points. Independents remain stable and close to the national average.
By State
| States with the highest opposition to refusals | States with the lowest | ||
|---|---|---|---|
| Massachusetts | 72% | Nebraska | 48% |
| Hawaii | 71% | Idaho | 47% |
| Vermont | 71% | Missouri | 47% |
| Connecticut | 70% | Oklahoma | 47% |
| District of Columbia | 70% | West Virginia | 44% |
By Religious Group
| Religious group | Oppose refusals |
|---|---|
| Hindus | 76% |
| Unitarians | 73% |
| Religiously unaffiliated | 72% |
| Hispanic Catholics | 72% |
| Buddhists | 70% |
| Black Protestants | 69% |
| American Jews | 67% |
| Muslims | 58% |
| White Catholics | 56% |
| White mainline Protestants | 55% |
| Hispanic Protestants | 54% |
| Jehovah’s Witnesses | 46% |
| Latter-day Saints | 44% |
| White evangelical Protestants | 31% |
Among white Christians, the share opposing service refusals rose from 49% in 2015 to 55% in 2020, but then fell to 46% – even below the 2015 level. Among Christians of color, opposition grew from 63% to 71% in 2022, dropped to 60% in 2024, and then rebounded to 65%. Among non-Christians and religiously unaffiliated, the peak came in 2021–2022, after which the figures returned to previous levels.
Age Trends
Opposition to service refusals declines with age: 61% among young adults (under 30), 62% among those 30–49, 57% among those 50–64, and 54% among older adults (65 and older). Among young Republicans, opposition has fallen from 49% in 2015 to 37% in 2025.
Transgender Rights
Attitudes toward transgender rights are more complex than toward other LGBT issues. On the one hand, 71% of Americans agree that transgender people deserve the same rights and protections as other citizens.
| Party | Agree with equal rights |
|---|---|
| Democrats | 88% |
| Independents | 77% |
| Republicans | 57% |
Majorities of all religious groups share this view.
| Religious group | Agree with equal rights |
|---|---|
| American Jews | 85% |
| Non-Christians (other) | 80% |
| Religiously unaffiliated | 80% |
| Latter-day Saints | 76% |
| Hispanic Catholics | 75% |
| White mainline Protestants | 75% |
| White Catholics | 73% |
| Black Protestants | 71% |
| Hispanic Protestants | 61% |
| White evangelical Protestants | 56% |
By race and education: support for equal rights is expressed by 76% of Asian Americans, 74% of multiracial Americans, and about 70% of white, African American, and Hispanic Americans. Among those with a college degree – 81%, without one – 66%.
Bathroom Laws
On the other hand, 56% of Americans support laws requiring transgender people to use bathrooms corresponding to the sex assigned at birth. Since 2016, support for such laws has risen by nearly 20 percentage points – from 35% to 54% by September 2025.
| Party | 2016 | 2025 |
|---|---|---|
| Republicans | 44% | 81% |
| Independents | 37% | 51% |
| Democrats | 27% | 30% |
Support among Republicans has nearly doubled since 2016. Among independents, it has risen by 14 points. Among Democrats, the change is minimal.
Among those who believe that transgender people deserve equal rights, 49% support bathroom laws. Among those who disagree, 77% do. In other words, agreeing with the principle of equal rights does not always mean opposing restrictive regulations on specific issues.
| Religious group | Support bathroom laws |
|---|---|
| White evangelical Protestants | 78% |
| Hispanic Protestants | 70% |
| White Catholics | 62% |
| White mainline Protestants | 60% |
| Black Protestants | 60% |
| Hispanic Catholics | 59% |
| American Jews | 40% |
| Religiously unaffiliated | 38% |
| Age group | Support bathroom laws |
|---|---|
| 18–29 | 49% |
| 30–49 | 54% |
| 50–64 | 59% |
| 65 and older | 59% |
| Men | 58% |
| Women | 53% |
| Without a college degree | 60% |
| College-educated | 47% |